Running ads on Google is one of the best ways to grow a business, but success depends on how well you understand the numbers behind your campaigns. Many beginners start Google Ads with excitement but soon feel lost when they look at the reports. The dashboard is full of data, charts, and terms that can look confusing at first.
If you want to spend your money wisely and increase your return on investment (ROI), you must learn how to read Google Ads reports like a pro. The good news is that you don’t need to be a data scientist to do this. With some guidance and practice, you can understand what the numbers mean, spot what’s working, and fix what’s not.
This blog will walk you step by step through Google Ads reports in simple, easy-to-understand language. By the end, you will feel more confident about reading your reports and making smart decisions for your ads.
Why Google Ads Reports Matter
Google Ads reports show you what happens after your ads go live. They give you data about clicks, impressions, conversions, costs, and more. Without reports, you’re driving blind—you won’t know which ads bring sales and which ones waste money.
Reports matter because they help you:
- Measure performance – See how your ads are performing against your goals.
- Find winning keywords – Identify which search terms bring in traffic and sales.
- Save money – Stop spending on ads that don’t perform well.
- Plan better – Use past data to improve future campaigns.
In short, reports are your map to success.
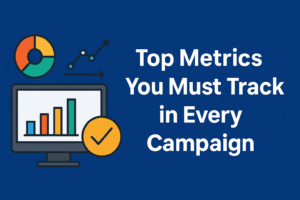
Key Terms You Must Know
Before diving into the reports, let’s clear up some important terms. These terms appear in almost every Google Ads report:
- Impressions: The number of times your ad was shown to people.
- Clicks: The number of times people clicked your ad.
- CTR (Click-Through Rate): The percentage of people who clicked after seeing your ad. (Clicks ÷ Impressions × 100).
- CPC (Cost Per Click): How much you pay for each click on average.
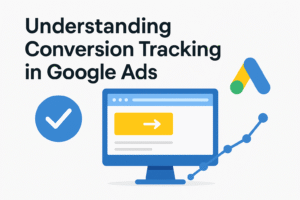
- Conversions: Actions you want users to take, such as purchases, sign-ups, or downloads.
- CPA (Cost Per Acquisition): How much you pay for each conversion.
- Quality Score: A score (1–10) showing how relevant your ad, keyword, and landing page are.
- Ad Rank: Determines your ad’s position on the page, based on bid and quality score.
These terms are the building blocks of understanding your reports.
Types of Google Ads Reports
Google Ads provides several types of reports. Each report focuses on different details of your campaign. Let’s go through the most important ones.
1. Campaign Report
This is the big picture view. It shows you how each campaign is performing. Here you can compare campaigns side by side and see where your budget works best.
Look for:
- Total spend
- Clicks and impressions
- Conversion rate
- Average CPC
Pro Tip: If one campaign has a much higher CPA than others, check the targeting and keywords.
2. Ad Group Report
Inside each campaign, there are ad groups. Ad groups contain related ads and keywords. The ad group report helps you see which groups of ads are most effective.
Look for:
- CTR of each group
- Cost differences between groups
- Which group gives the best ROI
3. Keyword Report
This is one of the most valuable reports. It shows exactly which keywords bring clicks and conversions.
Look for:
- High-performing keywords with good CTR and conversions
- Keywords with high CPC but no conversions
- Negative keywords (terms that waste money and need to be blocked)
Pro Tip: Use the Search Terms Report (a part of the keyword report) to see real phrases people type. Add irrelevant ones as negative keywords.
4. Ad Report
This report breaks down performance by ad. If you are running multiple ads in one ad group, this shows which one gets more clicks and conversions.
Look for:
- Which ad copy gets higher CTR
- Which ad leads to more conversions
- Test results from A/B testing ads
5. Audience Report
Not all audiences behave the same. Audience reports help you understand who is engaging with your ads.
Look for:
- Age, gender, device, or location performance
- Which audience segment brings the highest conversions
- Where to adjust bids for better targeting
6. Geographic Report
This shows performance by location. Maybe one city or country converts better than others.
Look for:
- High-performing locations
- Areas with wasted ad spend
- Opportunities to target new profitable locations
7. Device Report
This shows performance across desktops, mobiles, and tablets.
Look for:
- Higher CTR or conversions on mobile vs. desktop
- Whether your landing page is mobile-friendly
- If bid adjustments are needed for devices
How to Read Reports Step by Step
Here is a simple process to read and understand Google Ads reports:
Step 1: Define Your Goal
Before reading data, know what success looks like for you. Is it sales, leads, or traffic? Different goals focus on different metrics. For example:
- Sales goal → Focus on conversions and CPA.
- Traffic goal → Focus on clicks and CTR.
- Awareness goal → Focus on impressions and reach.
Step 2: Check the Overview
Start with the campaign overview to get a sense of the overall performance. Are clicks and conversions growing? Is spend under control?
Step 3: Dive Deeper
Go into keyword, ad, and audience reports to find details. Ask questions like:
- Which keywords give the best ROI?
- Which ads get the highest CTR?
- Which audience is converting best?
Step 4: Spot Patterns
Look for trends over time. Are conversions going up or down? Do weekends perform better than weekdays? These patterns help you plan better.
Step 5: Take Action
The most important part is action. Reading reports is useless if you don’t act. Based on what you see:
- Pause underperforming ads or keywords.
- Increase bids for high-converting keywords.
- Adjust targeting for better audiences or locations.
Common Mistakes to Avoid
While reading reports, beginners often make mistakes. Here are some to watch out for:
- Focusing only on clicks – Clicks don’t always mean sales. Conversions matter more.
- Ignoring Quality Score – A low score means higher costs. Improve ad relevance and landing page.
- Not checking search terms – Without checking, you may waste money on irrelevant searches.
- Looking at data too early – Give ads time to collect enough data before making big changes.
- Not segmenting data – Always break down by device, location, and audience for deeper insights.
Tips to Read Reports Like a Pro
- Use filters: Narrow down data by time, device, or location.
- Customize columns: Only keep the metrics that matter to your goal.
- Schedule reports: Get regular reports by email to stay updated.
- Compare date ranges: Always compare this week to last week or month to see changes.
- Focus on ROI: At the end of the day, conversions and profit matter more than impressions.
Final Thoughts
Reading Google Ads reports may look scary at first, but with practice, it becomes second nature. Think of reports as a mirror showing the health of your campaigns. If you learn to read them properly, you can:
- Save money by cutting waste
- Improve results by focusing on winners
- Grow your business with confidence
Start simple: learn the basic terms, check key reports, and slowly dig deeper. Over time, you will begin to see the story behind the numbers. That’s when you truly start reading Google Ads reports like a pro.
Remember, the power of Google Ads is not just in running ads—it’s in knowing what the numbers say and acting on them.
So, open your dashboard, go through the reports step by step, and take charge of your campaigns. Success is in the data—now you know how to read it.